Live charts are becoming increasingly important and popular. With rapidly changing business events and new data being generated after very short intervals of time, it is crucial to keep up with the latest statistics and trends.
Live charts help you visualize these changes and keep you current with the latest data updates.
Keeping in view the importance of live charts, we have compiled a guide that introduces you to the next big thing in live charts.
Continue reading to find out why all small or large businesses are turning to FusionCharts to fulfill all their real-time data visualization requirements.
What Are Live Charts?

Live charts are often referred to as data streaming charts, real-time charts, or self-updating charts. They are charts that continuously update themselves in real-time after user-defined time intervals.
Live charts fetch the data from the server automatically and refresh themselves without requiring any page reloads.
What Is the Next Big Thing in Live Charts?
More and more developers are turning to FusionCharts. FusionCharts is a beautiful Javascript library for creating real-time charts, graphs, gauges, and data-driven maps.
It is becoming more popular and widely adopted because of its aesthetic presentations, efficient data loading capabilities, interactive and responsive charts, and more.
This library comes with great features to support live data streaming charts.
Does FusionCharts Support Different Types of Real-Time Charts?
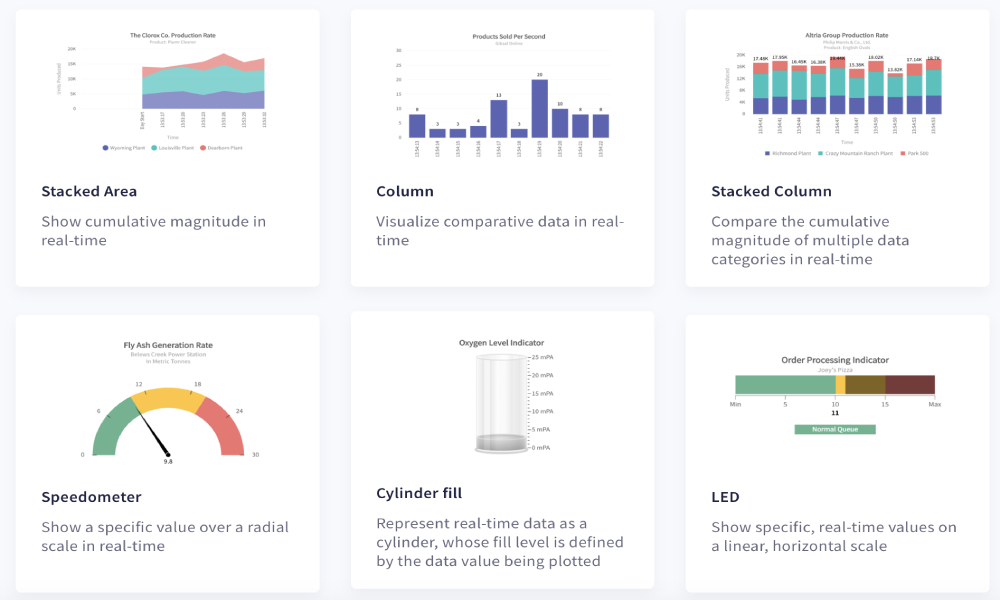
Yes, absolutely! FusionCharts supports a wide array of live charts, including:
- Line charts and dual-axis line charts
- Area charts and stacked area charts
- Column charts and stacked column charts
There are also other creative ways of representing specialized data using FusionCharts graphs and charts library. These visualizations include:
- Speedometer
- Cylinder fill
- LED
- Thermometer
- Bulb
Do FusionCharts’ Real-Time Charts Allow Event Handling?
Again, yes! FusionCharts allows you to capture different types of live data and chart events.
You can stick to default functionality or write your event handlers. Some data-related events include data loading and data updating at the data source.
You can also customize the behavior of the charts on events such as chart initialization and chart rendering.
This is a useful feature for scenarios in which the data source is updated frequently, and the users must view the latest values.
What Is a Message Logger and Alert Manager in FusionCharts’ Real-Time Charts?
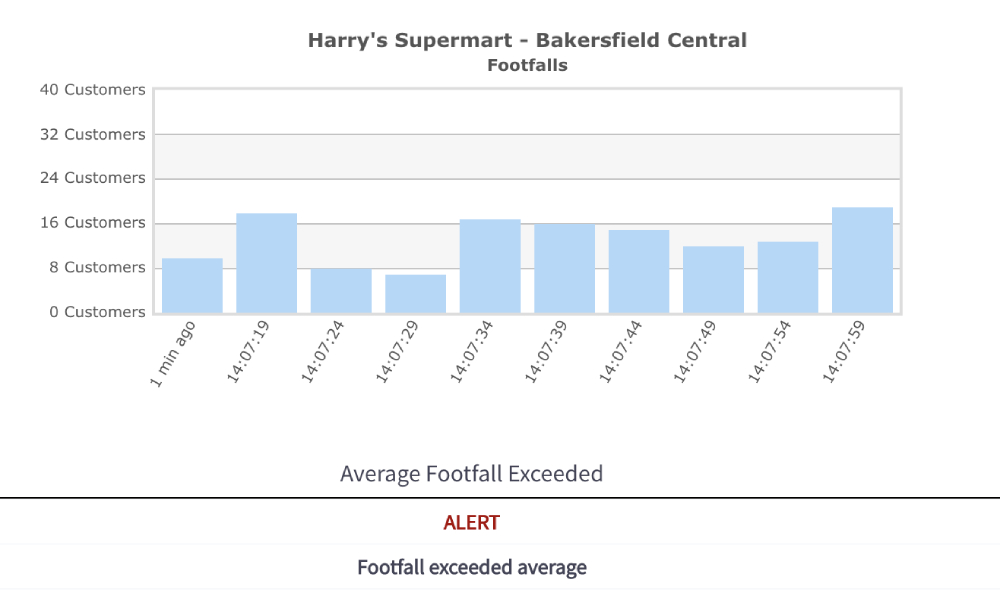
The message logger and the alert manager are essential features of a live chart, which can be easily configured and personalized in FusionCharts. The message logger is a unique chart window that shows real-time messages as the data updates itself.
If you have sensitive data, you can use the alert manager to inform the users when the latest data points are outside a specific normal data range.
Alternatively, you can generate specific actions if the data reaches critical values in certain pre-defined ranges.
Can I Define Update Interval and Refresh Interval of Live Charts in FusionCharts?
In FusionCharts, users have the option to define both the update interval and the refresh interval.
The update interval is the time period after which new data is fetched from the server. The refresh interval specifies when the chart or graph should be rendered again. Having a separate parameter for both updating and refreshing gives more flexibility to developers to define customized behavior.
Are Real-Time Updates of Multiple Datasets and Multiple Data Values Possible in FusionCharts?
Of course! When you use FusionCharts to build live charts with more than one dataset, you can determine how and when your chart refreshes. A single request to the server yields a response with many data values updated, all simultaneously.
What Are Interactive Legends in FusionCharts’ Real-Time Charts?
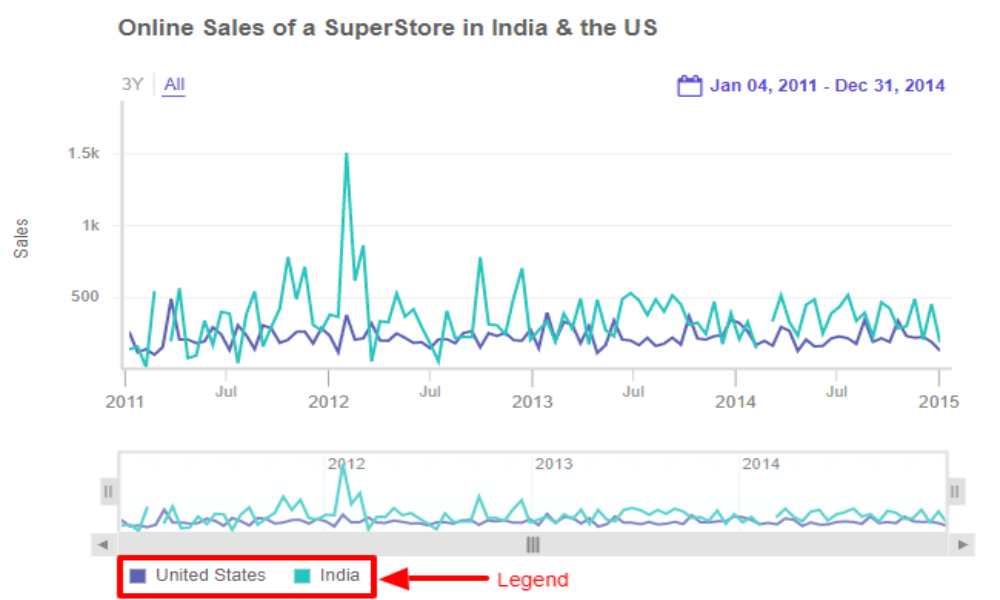
An interactive legend in real-time charts allows users to select a specific data series and hide the rest. It is also possible to draw attention to one particular data series by highlighting it relative to the others.
Can I Customize Real-Time FusionCharts?
With FusionCharts, you can customize everything. In all live charts, you can define your color schemes, text fonts, tick labels, axis labels, chart captions, number formatting, add annotations, and more in all live charts.
This gives your charts, graphs, and maps a personalized look and feel.
What is the Function of Context Menus in Real-Time Charts?
All live charts created using FusionCharts have a context menu displayed at the bottom left corner. The context menu includes several options such as switching on or off automatic updates, show log, etc.
How Do I Sign Up for FusionCharts?
FusionCharts is a fantastic JavaScript library that you can use to create live real-time charts that update themselves by fetching data from the server.
With its artistic and aesthetically pleasing data presentations, fast data processing features, interactivity, customizability, and much more, it is undoubtedly the next big thing in live charts.
Don’t wait anymore. Adopt FusionCharts, the best and the most popular JavaScript charting and graphing library, and sign up for your free trial now.