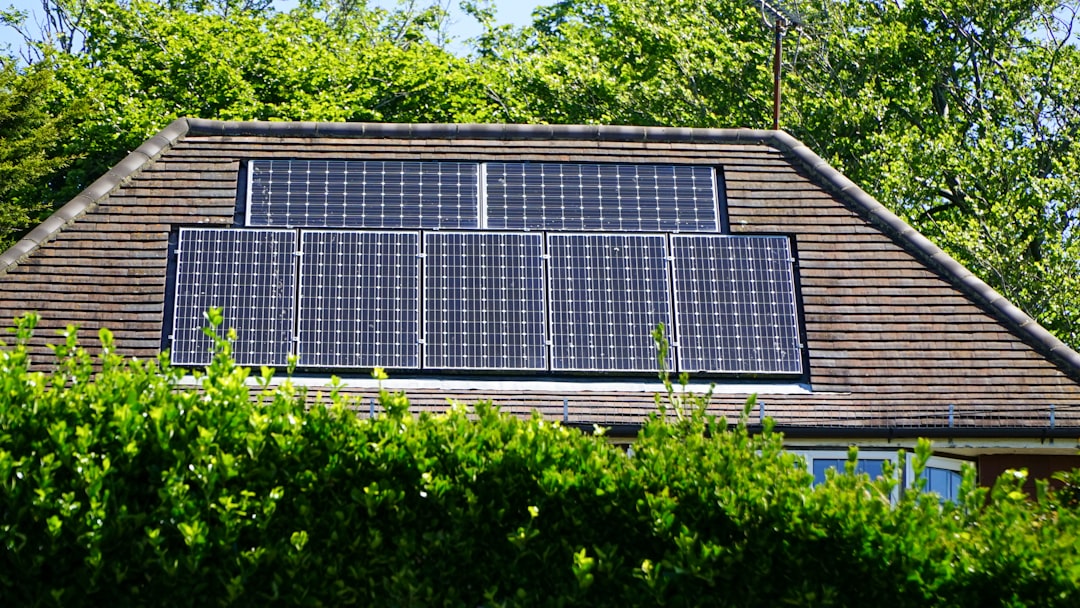
As the global demand for renewable energy grows, solar energy continues to stand out as one of the most accessible and affordable alternatives. But harnessing the sun’s power isn’t equally efficient across all geographies—local climate, average solar irradiance, and regional electricity costs play major roles in determining both energy output and financial returns. Assessing solar output by location enables homeowners and businesses to make informed decisions about investing in solar panel systems. This article delves into the city-to-city differences in solar energy performance, offering benchmarks for efficiency and financial payback from coast to coast.
Understanding Solar Output Efficiency
Solar output efficiency refers to how much electricity solar panels produce in a given location over time. It is typically measured in kilowatt-hours per kilowatt (kWh/kW) of installed capacity. Several factors influence this output:
- Solar irradiance: The intensity of sunlight received.
- Cloud coverage and weather: Sunny cities naturally outperform cloudier ones.
- Temperature: Unusually high temperatures can lower panel efficiency.
- Panel orientation and tilt: Affects exposure to optimal sunlight.
- Shading and pollution: Limit overall power generation.
City-to-City Solar Output Comparison
Below are solar output metrics for several U.S. cities that illustrate how geography impacts photovoltaic system performance:
| City | Average Solar Irradiance (kWh/m²/day) | Annual Output per 5kW System (kWh) |
|---|---|---|
| Phoenix, AZ | 6.5 | 8,800 |
| Denver, CO | 5.5 | 7,900 |
| San Diego, CA | 5.8 | 8,100 |
| Atlanta, GA | 4.7 | 7,000 |
| Seattle, WA | 3.8 | 5,500 |
From these figures, one can see that desert climates like Phoenix offer maximum production potential due to strong solar irradiance and relatively few cloudy days. Coastal cities such as San Diego also perform well thanks to moderate weather and average sun exposure. On the other hand, cities with frequent cloud cover, notably Seattle, tend to generate far less renewable electricity annually.

Financial Payback: Where Location Meets Savings
Solar payback period refers to the number of years it takes for solar panel owners to recoup their initial investment through savings on electricity bills. This period depends on a variety of factors beyond just output:
- Electricity rates: Higher local rates can shorten the payback time.
- Incentives and rebates: Federal tax credits, state programs, and net metering policies significantly improve ROI.
- Installation and system costs: Prices vary based on market competitiveness and labor costs.
Average payback periods for a standard residential 5kW system by city are as follows:
| City | Average Electricity Rate (¢/kWh) | Estimated Payback Period (Years) |
|---|---|---|
| Los Angeles, CA | 23 | 6 – 7 |
| New York City, NY | 21 | 7 – 8 |
| Houston, TX | 13 | 9 – 10 |
| Miami, FL | 12 | 10 – 11 |
| Chicago, IL | 14 | 8 – 9 |
Even in places with modest solar output like Chicago, the relatively high cost of utility electricity and local subsidies help maintain reasonable payback timelines. In contrast, cities with cheap electricity and fewer sunny days experience extended ROI periods unless assisted by aggressive incentives.
Key Takeaways for Solar Prospects
For homeowners and investors considering solar panel systems, the choice of location significantly influences both energy production and long-term financial benefits. Here are several general insights to guide decision-making:
- Western and Southwestern cities deliver the greatest energy yields per installed kilowatt-hour.
- Availability of tax credits and SRECs (Solar Renewable Energy Certificates) can dramatically improve ROI.
- Consider not just output but also your personal energy usage patterns and financial goals.
- Work with certified installers who understand local permitting, rebates, and utility policies.

As energy markets evolve and technology prices drop, solar becomes an increasingly smart choice in a growing number of locales. Whether someone lives in sun-rich Arizona or cloudier Pennsylvania, the long-term economic and environmental payoff remains considerable.
Frequently Asked Questions (FAQ)
-
Q: Does solar make sense in cloudy or northern cities?
A: Yes, modern solar panels are designed to operate efficiently in low-light conditions. While output is naturally lower, government incentives and high electricity prices in many northern cities can still make solar a worthwhile investment. -
Q: What is the average solar payback period in the U.S.?
A: The national average payback period ranges between 6 to 10 years, depending on location, electricity rates, and available incentives. -
Q: How do I find the solar potential of my home?
A: Tools like Google Project Sunroof and PVWatts by the National Renewable Energy Laboratory can estimate solar output based on your roof’s orientation, shade, and local weather. -
Q: Are solar panels still effective in winter?
A: Yes, solar panels work in winter. In fact, cooler temperatures improve photovoltaic efficiency. However, snow accumulation can temporarily reduce output if it blocks sunlight. -
Q: How long do solar panels last?
A: Most solar panels come with a 25- to 30-year performance warranty, but they often continue generating electricity well beyond that, albeit at lower efficiency.
Choosing solar is no longer just about “going green”—it’s a smart financial move when approached with research and proper planning. No matter the city, understanding your region’s solar performance benchmarks and cost structures is the first step to unlocking the full value of solar power.


