Open-source AIOps is less about finding one magical platform and more about assembling a practical, intelligent operations stack. Modern reliability teams need tools that can collect telemetry, detect anomalies, correlate noisy events, identify likely root causes, and trigger safe automation. The good news is that open-source ecosystems now cover much of this journey, from metrics and logs to traces, Kubernetes diagnostics, and runbook execution. The challenge is knowing which tools do what well, where they overlap, and where you may still need engineering glue.
TLDR: Open-source AIOps tools are strongest in monitoring, observability, alerting, and automation orchestration, while advanced event correlation and root cause analysis often require combining multiple projects. Prometheus, Grafana, OpenTelemetry, Loki, Elasticsearch/OpenSearch, Jaeger, and SigNoz form a powerful observability foundation. Tools like Robusta, Coroot, StackStorm, Rundeck, and Keptn add workflow automation, Kubernetes troubleshooting, and remediation capabilities. The best approach is usually a composable stack rather than a single all-in-one platform.
What Makes a Tool “AIOps”?
AIOps, short for artificial intelligence for IT operations, refers to using data, analytics, and automation to improve operational decision-making. In practice, open-source AIOps usually includes four major capabilities:
- Monitoring: Collecting metrics, logs, traces, events, and health signals from infrastructure and applications.
- Event correlation: Grouping related alerts and reducing noise so teams can focus on real incidents.
- Root cause analysis: Identifying the most likely source of degradation or failure.
- Automation: Running playbooks, remediations, deployments, notifications, or incident workflows.
Unlike commercial AIOps platforms, open-source tools tend to specialize. One project may be excellent for metrics, another for distributed tracing, another for automation, and another for Kubernetes insight. That modularity is a strength if you want flexibility, but it also means architecture matters.

The Observability Foundation: Prometheus, Grafana, and OpenTelemetry
Prometheus is one of the most widely adopted open-source monitoring systems. It excels at scraping metrics, storing time-series data, and evaluating alerting rules. Paired with Alertmanager, it can route, group, silence, and deduplicate alerts. Prometheus is not a complete AIOps platform by itself, but it is often the data backbone of one.
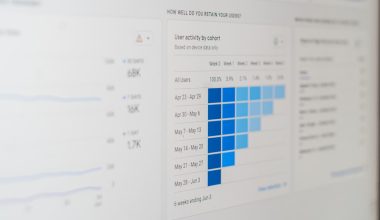
Grafana turns observability data into readable dashboards and operational views. It integrates with Prometheus, Loki, Elasticsearch, OpenSearch, Tempo, InfluxDB, and many other sources. Grafana’s alerting capabilities have improved significantly, making it useful for unified alert management across different telemetry backends.
OpenTelemetry is not a monitoring dashboard or database; it is a vendor-neutral standard and toolkit for collecting telemetry. It helps teams instrument applications once and send metrics, logs, and traces to many destinations. For AIOps, OpenTelemetry is important because quality analytics depend on consistent, well-labeled data.
Best for: Metrics monitoring, dashboards, alerting, and telemetry standardization.
Limitations: Root cause analysis and event correlation require additional systems, conventions, or custom logic.
Logs and Search: Elasticsearch, OpenSearch, and Loki
Logs remain essential for incident investigation. Elasticsearch has long been a popular engine for log indexing and search, while OpenSearch provides an open-source alternative with similar capabilities. These tools are powerful when teams need full-text search, structured log analytics, anomaly detection plugins, and large-scale indexing.
Grafana Loki takes a different approach. Rather than indexing every word, Loki indexes labels and stores log streams efficiently. This makes it cost-effective and naturally aligned with Kubernetes and Prometheus-style labels. Loki is especially strong when logs are used alongside metrics and traces inside Grafana.
- Elasticsearch and OpenSearch: Better for deep search, complex querying, and broad log analytics.
- Loki: Better for cloud-native log aggregation, lower indexing cost, and Grafana integration.
For AIOps use cases, logs become most valuable when correlated with alerts, deployments, infrastructure changes, and traces. Without shared metadata such as service name, environment, cluster, version, and owner, log search can become slow detective work instead of automated insight.
Tracing and Service Dependency: Jaeger, Tempo, and Apache SkyWalking
Distributed tracing is critical for understanding microservices. Jaeger is a mature open-source tracing system used to track requests across services. It helps teams see latency, bottlenecks, and dependency paths. Grafana Tempo is another tracing backend designed for high-scale, cost-efficient trace storage, especially when used with Grafana, Loki, and Prometheus.
Apache SkyWalking goes further by offering application performance monitoring, service topology, metrics, traces, and logs in a more integrated package. It can automatically detect service relationships and present dependency maps that are useful during root cause analysis.
Best for: Understanding service behavior, latency propagation, and dependency chains.
Limitations: Tracing systems help explain where a request slowed down, but they do not always explain why a database, pod, network path, or external dependency failed.
Kubernetes-Focused AIOps: Robusta, Coroot, and Netdata
Kubernetes environments generate a huge amount of operational noise. Pods restart, nodes fluctuate, deployments roll out, autoscalers react, and workloads move constantly. Several open-source tools focus on making this chaos easier to understand.
Robusta is an automation and enrichment tool for Kubernetes alerts. It can connect Prometheus alerts with contextual information such as pod logs, recent events, deployment changes, and resource usage. Instead of receiving a bare alert like “PodCrashLooping,” teams can receive a richer notification that includes likely clues and links to relevant diagnostics.
Coroot is an observability and troubleshooting tool designed to identify service issues in Kubernetes and cloud-native systems. It automatically builds service maps, highlights performance problems, and can point to likely causes such as DNS errors, memory pressure, connection failures, or slow dependencies. Coroot is particularly interesting because it moves closer to practical root cause analysis rather than simply presenting raw telemetry.
Netdata provides real-time infrastructure monitoring with automatic dashboards and anomaly detection features. It is easy to deploy and useful for quickly understanding system-level behavior across nodes, containers, and applications.
- Robusta: Strong for alert enrichment and Kubernetes incident context.
- Coroot: Strong for service maps, dependency insight, and likely cause detection.
- Netdata: Strong for immediate infrastructure visibility and real-time metrics.
Event Correlation: Where Open Source Is Improving
Event correlation is one of the hardest AIOps capabilities to implement well. The goal is to turn hundreds of alerts into a small number of meaningful incidents. Open-source stacks often approach this through a combination of alert grouping, labels, topology, and rules.
Alertmanager provides basic but valuable correlation through grouping and deduplication. For example, alerts can be grouped by cluster, service, severity, or namespace. This reduces duplicate pages, but it is not the same as intelligent causal correlation.
Grafana Alerting can centralize rules across multiple data sources, while notification policies help route related alerts. OpenSearch and Elasticsearch can support correlation through queries, transforms, anomaly detection plugins, and custom pipelines. Some teams build correlation layers using Kafka, Flink, or custom Python services to process event streams.
The missing ingredient is usually a reliable model of system relationships. If your tools know that service A depends on service B, and service B depends on database C, then correlation becomes much smarter. This is where service maps from tracing tools, Kubernetes metadata, and dependency graphs from platforms like SkyWalking or Coroot become valuable.
Root Cause Analysis: From Dashboards to Probable Causes
Root cause analysis in open-source AIOps spans a spectrum. At the basic level, dashboards help humans investigate. At the advanced level, tools suggest probable causes automatically.
Prometheus and Grafana support RCA by exposing symptoms over time: CPU spikes, memory saturation, error rates, request latency, queue depth, and saturation indicators. Loki or OpenSearch can reveal error messages and exceptions. Jaeger, Tempo, or SkyWalking can show where latency or failure appears in a distributed request path.
Tools like Coroot attempt to bring these signals together into more direct conclusions. For example, if a service is slow because upstream DNS lookups are failing or because a downstream service is returning errors, that relationship can be surfaced faster than manual dashboard hopping.
However, open-source RCA is most effective when teams follow good telemetry hygiene:
- Use consistent labels for services, environments, clusters, versions, and teams.
- Track deployments and changes so incidents can be linked to recent releases.
- Collect all three signals: metrics, logs, and traces.
- Maintain service ownership data so alerts reach the right responders.
- Define SLOs to distinguish user-impacting incidents from harmless noise.
Automation: StackStorm, Rundeck, Keptn, and Argo Workflows
Automation is where AIOps turns from detection into action. Open-source tools offer several approaches, from human-approved runbooks to fully automated remediation.
StackStorm is an event-driven automation platform. It can listen for alerts, webhooks, or monitoring events, then trigger workflows such as restarting services, scaling resources, opening tickets, or posting to chat. Its strength is connecting many systems through rules and actions.
Rundeck is widely used for runbook automation. It gives teams controlled, auditable execution of operational tasks. Unlike hidden scripts on an engineer’s laptop, Rundeck jobs can include permissions, approvals, logs, and repeatable steps.
Keptn focuses on cloud-native lifecycle automation, quality gates, and remediation. It is useful when teams want to connect observability signals to deployment decisions, such as automatically evaluating whether a release meets service-level objectives.
Argo Workflows and Argo CD are not AIOps tools in the narrow sense, but they are often part of automation-heavy operations. Argo can run workflows, manage GitOps deployments, and support progressive delivery patterns when combined with metrics and policy checks.
Comparison of Open-Source AIOps Capabilities
| Tool | Monitoring | Event Correlation | Root Cause Analysis | Automation |
|---|---|---|---|---|
| Prometheus and Alertmanager | Excellent metrics collection and alerting | Good grouping and deduplication | Manual analysis through metrics | Limited, via webhooks |
| Grafana | Excellent visualization and unified alerting | Moderate, policy-based | Strong investigation interface | Limited native automation |
| OpenTelemetry | Excellent telemetry collection standard | Indirect support through metadata | Enables better RCA data | None by itself |
| Loki, OpenSearch, Elasticsearch | Strong log analytics | Moderate with rules and queries | Strong forensic investigation | Possible through integrations |
| Jaeger, Tempo, SkyWalking | Strong tracing and dependency visibility | Good when topology is used | Strong for latency and service path analysis | Limited |
| Robusta | Uses existing monitoring signals | Good Kubernetes alert enrichment | Good contextual troubleshooting | Good playbook-style actions |
| Coroot | Good cloud-native observability | Good dependency-aware insight | Strong probable cause detection | Limited compared with automation platforms |
| StackStorm and Rundeck | Not primary monitoring tools | Depends on incoming events | Depends on workflow logic | Excellent operational automation |
Recommended Open-Source AIOps Stack Patterns
For many teams, a sensible open-source AIOps architecture looks like this:
- Telemetry collection: OpenTelemetry, Prometheus exporters, Kubernetes metrics, application instrumentation.
- Metrics and alerting: Prometheus, Alertmanager, Grafana.
- Logs: Loki for cloud-native environments, or OpenSearch for heavier search requirements.
- Traces: Tempo, Jaeger, or SkyWalking.
- Kubernetes context: Robusta and Coroot.
- Automation: StackStorm, Rundeck, Keptn, or Argo Workflows.
A smaller team might start with Prometheus, Grafana, Loki, and Alertmanager, then add tracing and automation later. A platform engineering team running Kubernetes at scale may benefit from adding OpenTelemetry, Tempo, Robusta, Coroot, and StackStorm earlier.
How to Choose the Right Tools
The best toolset depends on your operational maturity. If your main problem is lack of visibility, start with monitoring and dashboards. If your problem is alert fatigue, improve labels, routing, deduplication, and service ownership before chasing advanced machine learning. If your incidents take too long to diagnose, invest in traces, dependency maps, and change tracking. If engineers repeatedly perform the same fixes, introduce runbook automation.
It is also worth being realistic about the word AI. Many open-source tools provide analytics, anomaly detection, topology awareness, and automated workflows, but fewer offer sophisticated machine-learning-driven diagnosis out of the box. In practice, the biggest wins often come from clean telemetry, sensible alert design, and reliable automation rather than from complex models.
Final Thoughts
Open-source AIOps has become powerful enough for serious production environments, especially when teams embrace a composable architecture. Prometheus, Grafana, OpenTelemetry, Loki, OpenSearch, Jaeger, Tempo, SkyWalking, Robusta, Coroot, StackStorm, Rundeck, Keptn, and Argo each solve important pieces of the puzzle. The key is not to deploy every tool, but to build a coherent pipeline from signal collection to insight and action.
The most successful AIOps implementations start with a simple question: What operational decision should this data help us make faster? When tools are chosen around that goal, monitoring becomes more than dashboards, alerts become more than noise, root cause analysis becomes less guesswork, and automation becomes a safe way to scale reliability.